Electric Endpoint Management
New meters can be installed in the network with no special tools or radios required. The device is plug and play; this means that the installer can plug the meter in, and walk away. In its simplest form the meter can be installed using a pen and pencil.
When the endpoint is powered up it will perform the following:
•Transmit RF Registration packet. The RF Registration packet identifies the device on the network. Once this packet is received by Command Center, the endpoint will transition to Discovered status.
The endpoint will transmit the RF Registration packet as soon as it discovers a neighbor, and every two hours there after until it receives the SetWAN command.
•Transmit Init Push packet. The Init Push packet is transmitted as soon as the endpoint discovers a neighbor, then every twelve hours there after until it receives the SetWAN command.
The Init Push packet contains configuration information about the meter, that allows Command Center to understand the configuration of the meter. This information will vary dependent on the configuration of the meter, but generally includes:
•Reporting for Interval Data
•Reporting for Register Data
•Time Synchronization parameters
•GMT offset
•Meter Configuration information
1.Layered Routing
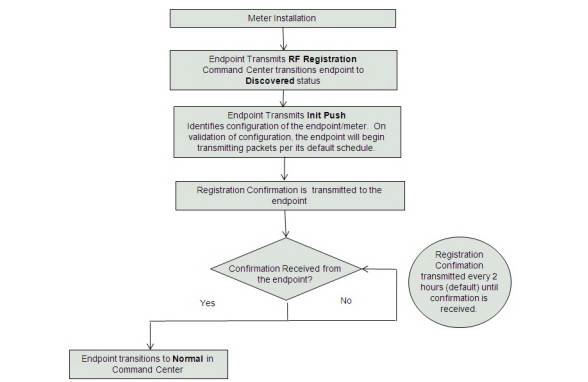
Figure 6 - 1. Layered Routing
i.Upon receipt of the RF Registration and InitPush packets, Command Center will send a Confirm Registration command to the endpoint.
ii.The endpoint transmits confirmation that it has received the Confirm Registration.
iii.The endpoint transitions to Normal status.
The Manufacturer Data page allows the user to import an XML or CSV file supplied by the meter manufacturer to seed new devices into Command Center's inventory.
1.Click Operations > Import > Manufacturer Data to display the Import Manufacturer Data page.The Import Manufacturer Data window will open. With Command Center release 7.1, the imported meter can also be moved to the Quarantine status group. See “Quarantine Status Groups” on page 126.
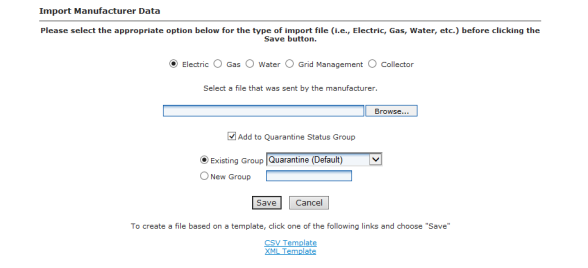
Figure 6 - 2. Import Manufacturer Data
2.Select the correct Meter Type radio button. Meter type selections will vary with license activation. Selections may include:
•Electric
•Gas
•Water
•Grid Management
•Collector
3.Click the Browse button to navigate to, and select, a file that was sent by the meter manufacturer.
...or...
4.To create a Manufacturer Data file based on a template, choose from CSV Template or XML Template and select Save.
5.Click the Save button to import the file into the database.
The Import Manufacturer Data (Upload Complete) window will appear displaying the Error Summary (if applicable) and Successful Entries.
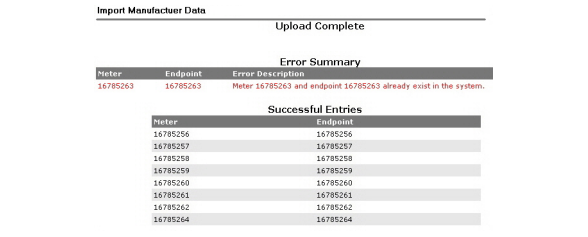
Figure 6 - 3. Upload Complete Window
NOTE: Any entries under Error Summary will be red text. The usual reason for an entry under Errors is that the endpoint already exists in the system. If file parsing errors or other file-related errors occur, contact the meter manufacturer that supplied the file.
6.Successful entries will be added to inventory and will be displayed on the dashboard as Inventory status.
Meter deployment details can be imported by use of an Installation Data file provided by the installer. Following is the procedure for importing the installation file.
1.Click Operations > Import > Installation Data to display the Import Installation Data page.
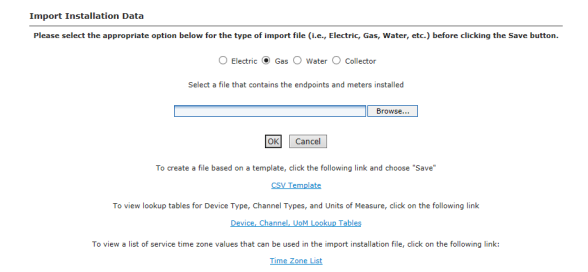
Figure 6 - 4. Import Installation Data
2.Select the Electric radio button.
3.Enter the Path to the file.
...or...
Click the Browse button to navigate to, and select, a file containing the endpoint information.
4.Click OK to upload the file. The information imported via the Installation Data File:
|
Data |
Format |
Format/Description |
|---|---|---|
|
User ID* |
AlphaNum (30) |
Login assigned by the utility for the installer. Utility may elect to use “1” for System usage. |
|
Installation Date* |
Date MM/DD/YYYY 12/26/2009 |
Actual date the meter was installed. This date is used in various Command Center reports to track deployment statistics. |
|
Installation Time* |
Time HHMM AM/PM 11:12 AM |
Actual time the meter was installed. This date is used in various Command Center Reports to track deployment statistics. |
|
Change Out meter number |
AlphaNum (20) |
The meter being replaced with a new meter. Meter change out information is displayed in the notes section of the endpoint information screen. |
|
Change Out meter kWh |
AlphaNum (20) |
The kWh reading on the meter being replaced Meter change out kWh information is displayed in the notes section of the endpoint information screen. Variable Character. |
|
Installed Meter Number* |
AlphaNum (20) |
Meter number of the new meter being installed. This meter must exist in Command Center prior to importing the Import Installation File. Must parse to Decimal format. |
|
Installed Endpoint Serial Number* |
Decimal (9) |
The serial number of the new meter being installed. Note: Endpoint serial numbers must be converted from Hex to Decimal. |
|
Installed Meter kWh |
Decimal (9) |
Initial reading of the new meter. |
|
Service Latitude |
Decimal (12,8) |
GPS latitude. |
|
Service Longitude |
Decimal (12,8) |
GPS longitude. |
|
Service Location |
AlphaNum (100) |
Meter service location. |
|
Service Time Zone |
See formatting below. |
The service time zone may be entered to specify the correct time zone for the service location. |
|
Tenant Group |
AlphaNum |
The tenant group name for the meter. |
Import Information File CSV Format requirements
CAUTION: Required fields are UserID, Installed Date, InstalledTime, InstalledMeterNo, and InstalledEndpointSN. If these fields are not populated, the file will not be processed. Service Location is required if the Latitude and Longitude fields are populated. Command Center will ignore the latitude and longitude values if Service Location is not provided.
The Installation Data file window provides a CSV template link. Click this link to view the format requirements for the file. This template can be saved to a network location or local machine and provided to the installer.
The Installation file must be of the following format:
•The first line must be a header.
•A comma is required to separate each item even if no data exists.
•A Service location is required if the service latitude and longitude are provided.
In order to report reading time correctly, the endpoint must be programmed with the appropriate time zone; this is achieved by sending commands to the endpoint that indicates the time zone in which the endpoint is installed and whether Daylight Savings Time (DST) is observed in the given time zone.
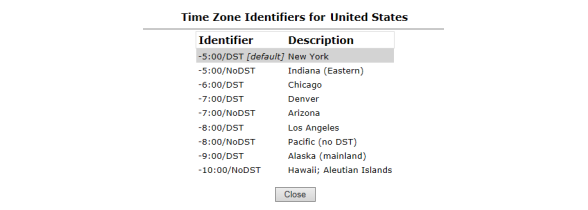
The Installation Data file should include the endpoint time zone. Clicking the Time Zone List link will open a document that displays a list of valid time zone designations by country.
The Import Mass Archive Endpoint option allows the user to easily archive large numbers of endpoints by uploading a flat file.
•Only devices that are in the user's assigned Tenant Groups will be modified in any way.
•Devices that are not in the user's assigned groups will be skipped, and no action taken for that row in the imported file.
1.Select Operations > Import > Mass Archive Endpoints. The Import Mass Archive Endpoints page will open.
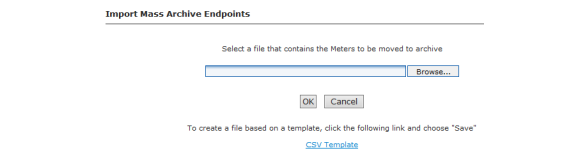
Figure 6 - 6. Import Mass Archive Endpoints
2.Enter a path to a file name
...or...
Click Browse and locate a file that contains the Meters to be moved to inventory.
NOTE: Click the CSV Template link to create a file based on a template.
3.Click OK to import the file.
Import Mass Inventory Endpoints
The Import Mass Inventory Endpoint screen enables the user to easily inventory large numbers of endpoints. It allows the user to upload a flat file of large numbers of endpoints.
1.Click Operations > Import > Mass Inventory Endpoints.
The Mass Inventory Endpoints screen will open.
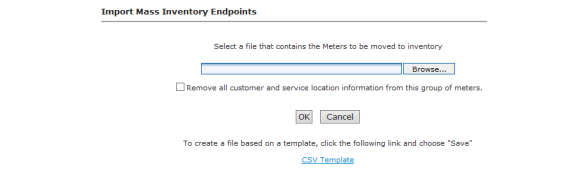
Figure 6 - 7. Import Mass Inventory Endpoints
2.Click the Browse button to navigate to, and select, a file containing the endpoint information.
...or...
To create a Mass Inventory Endpoints file based on a template, choose from CSV Template or XML Template and select Save.
3.Select the Remove all customer and service location information from this group of meters check-box if applicable.
4.Click the Save button to import the file into the database.
NOTE: This process is only applicable if you are not using the Over the Air Meter Reprogramming feature. See “Over the Air Meter Reprogramming” on page 203.
The Meter Program ID data item has been added to support being returned by the meter and extracted into third party systems. Command Center allows for the mapping of a specific Meter Program ID to a Configuration Group. This is a one-to-one relationship. Every time a Meter Program ID is pushed, validation will occur to ensure the meter is in the correct configuration group. If a different configuration group is required for a specific meter, a new Meter Program ID must be loaded to the meter so this new configuration group will become available.
This automatic reconfiguration by meter program ID is a configuration setting within Command Center. By default, Command Center will not perform automatic re-configuration
WARNING: Please contact Landis+Gyr before enabling automatic reconfiguration.
1.Select Operations > Import > Program Mapping to display the Import Program Mapping page.
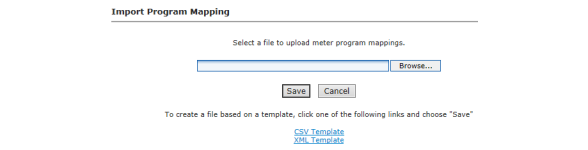
Figure 6 - 8. Import Program Mapping
2.Enter the Path to the file.
...or...
Click the Browse button to navigate to, and select, a file containing the endpoint information.
3.Click Save to upload the file. The information imported via the Installation File:
Program Mapping CSV Format Requirements
CAUTION: Required fields are MeterProgram, MeterModel and ConfigurationGroup. If these fields are not populated, the file will not be processed.
The Import Program Mapping page provides a CSV or XML Template link. Click this link to view the format requirements for the file. This template can be saved to a network location or local machine and provided to the installer.
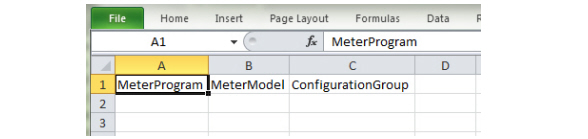
Figure 6 - 9. CSV Template Fields
Import of the Program Mapping file is audited in Command Center, and transactions are viewable in the Import Operations Audit Report.
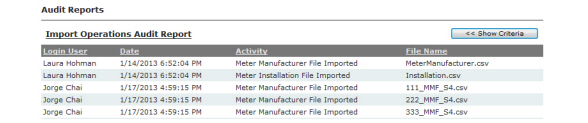
Figure 6 - 10. Import Operations Audit Report
Once imported, Command Center users may view current Meter Program/Configuration Group mapping: Setup > Firmware > View Meter Program Mapping.
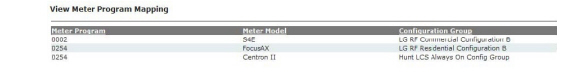
Figure 6 - 11. View Meter Program Mapping
Creating a packet definition is necessary to reconfigure the packet payload of an endpoint. Packet definitions can contain several different user-configurable data elements.
NOTE: RF endpoints allow a user to return up to 6 registers. However, the more registers returned, the greater the strain on the network.
1.Click Setup > Packet Definitions > RF Residential or RF Commercial
The Packet Definitions window will be displayed.
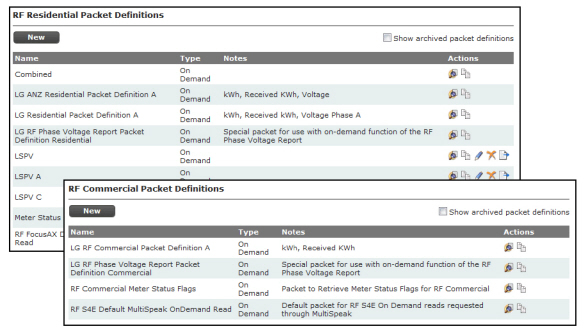
Figure 6 - 12. Packet Definitions Window
2.In the Packet Definitions window (above) click the New button to display the Packet Definition window.
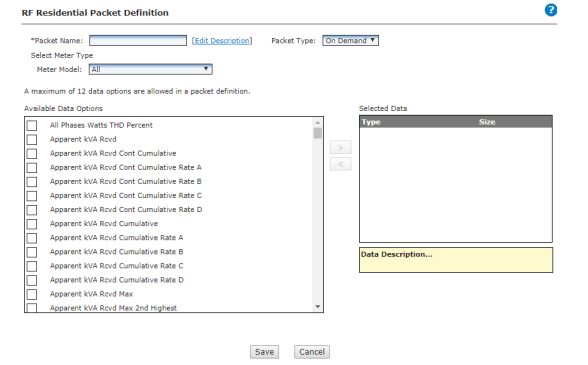
Figure 6 - 13. The Packet Definition Page
3.Enter a name in the Packet Name field. The name should be unique to the organization.
4.Click the Edit Description link to enter any desired notes for the packet definition. If any notes were entered, click the OK button to save them.
5.Select a Packet Type from the drop-down.
•On Demand
...or...
•Daily
6.Select the Meter Type from the drop-down menu.
7.Select the desired data options from the Available Data Options window on the left side of the window. A maximum of 12 data options are allowed in a packet definition.
To view a description of each available data option, click once on the data element. A description of the data element will be displayed in the yellow shaded box in the lower-center area of the window.
NOTE: The available data options vary depending on the type of endpoint.
8.Click the right pointing arrow to move the data option to the Selected Data window.
As you select data options, monitor the Packet Capacity gauge on the right of the window. Each selection will add to the percentage total. If your selections exceed 100 percent, a message will be displayed when you click the Save button indicating that packet capacity must be 100% or less. You can remove selections from the Selected Data window by clicking to highlight the selection and then click the left pointing arrow to remove the selection.
9.After selecting all of the desired data options, click the Save button to save the new packet definition.
A Configuration Group is a type of Command Addressing Group. A meter can be a member of only one configuration group. All members of a configuration group must be assigned the same configuration settings. Configuration groups are used to drive group-based reconfigurations for multiple endpoints.
Each endpoint type is manufactured with a default configuration group.
The data transmitted by an RF module, how frequently the data is sent, and how the module responds to conditions in the field, is dictated by the endpoint’s Configuration Group. The RF Configuration Group also allows the utility to determine when meters are read, and when data is pushed.
An RF Endpoint configuration consists of the following:
•Packet Definitions that are built for various data elements to be captured by the endpoint.
•Alarm Definitions that establish the priority associated with events that occur in the RF endpoints.
•RF Network Settings that establish the outage wait and time synchronization settings.
•A schedule that includes the commands and packet definitions, along with time settings and frequency settings associated with data transmission, that are stored in the endpoint.
1.Click Setup > Groups > Endpoint Configuration Groups > RF Residential Meters or RF Commercial Meters.
The Configuration Group window will be displayed.
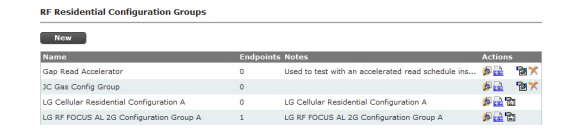
Figure 6 - 14. Configuration Groups Window
If you wish to view the details of an existing configuration group, perform the following steps.
a.In the Configuration Group window click the View Endpoints icon for the Configuration Group you want to view to display the Group Summary page.
b.Click any of the available links to display selected the Group Membership List, Figure 6 - 16.

The group membership list displays the following categories:
•Status. Status is the current status of the meter.
•Total Meters. Displays the total number of meters in each status.
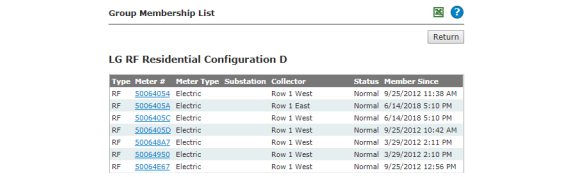
Figure 6 - 16. Group Membership List
c.Click any of the meter number links to view the Endpoint Information page for the selected meter.
2.In the Configuration Groups window click the New button to display the Configuration Group Properties window.
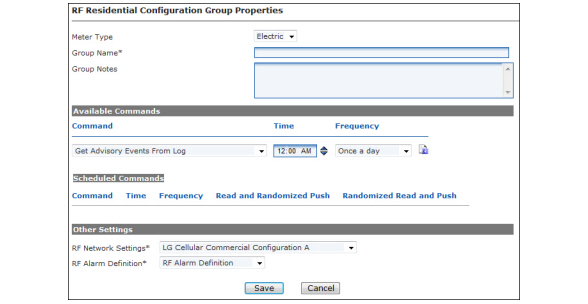
Figure 6 - 17. Configuration Group Properties Windows
Enter RF Configuration Group Properties
1.Select the Meter Type from the drop-down menu list.
2.Enter a Group Name. The name must be unique within the organization.
3.Enter any desired Group Notes.
4.Set up Available Commands. Electric Meters Only.
a.Select the desired packet definition from the Command drop-down.
b.Select the Time at which the reading will be taken from the meter. Adjust the time by clicking on either the hours, minutes, or AM/PM and then using the up or down arrow.
c.Select the Frequency with which the reading will be taken from the meter.
If either Every n minutes or Every n hours is selected, an additional field, N, will be displayed.
•Select the desired interval from the Frequency drop-down.
5.Click the Schedule Command icon to add the command to the Scheduled Commands list.
•Read and Randomized Push. If the Read and Randomized Push check box is selected, the reading will be taken at the scheduled time, and randomly sent to Command Center. Only packet definition may be selected for Read and Randomized Push, and the packet must not be greater than 200 bytes may be selected for this option.
•Randomized Read and Push. If the Randomized Read and Push is selected, the read will be randomly taken, and pushed immediately to Command Center.
6.Select Other Settings
•Select the appropriate RF Network Settings from the drop-down menu.
•Select an RF Alarm Definition from the drop-down menu.
7.Click the Save button to save the new configuration group.
Add Meters to a Endpoint Configuration Group
Adding meters to a configuration group initiates the configuration process.
1.Click Setup > Groups > Endpoint Configuration Groups and select the endpoint type.
The Configuration Group window will be displayed.
Figure 6 - 18. Configuration Group Window
2.Click the Add Endpoints icon for the Configuration Group to which you want to add endpoints in order to display the Add Endpoints to Group window.
Figure 6 - 19. Add Meters to Group Window
3.Click the Endpoint(s) radio button and enter individual meter numbers separated by spaces, commas, or semi-colons.
4.Click the Endpoint File radio button and then the Browse button to browse for a .csv file containing all the necessary endpoint numbers.
5.Click the Add button and then the Exit button to save the additions.
After clicking the Add button, the user will receive feedback on how many meter numbers were successfully and/or unsuccessfully added. The reason for an unsuccessful message is that the meter number does not exist.
NOTE: If an endpoint is already in a configuration group, the endpoint will be removed from the original and added to the new configuration group.
During normal operation field personnel replace meters, install new meters or remove meters from the field. If the utility’s CIS software is integrated with Command Center, these types of changes will be initiated from the CIS software.
The following procedures should be used if CIS is not initiating the changes in Command Center.
A meter replacement is a two step process.
•Remove old (existing) meter from Command Center
•Install new meter in Command Center
A meter replacement is a two step process.
•Remove old (existing) meter from Command Center
•Install new meter in Command Center
The Meter Change Out Report will allow the utility to generate a listing of all meter change outs processed by Command Center via the endpoint maintenance window, for a user-specified date range. The report is generated as a printer friendly report or can be exported to an Excel file.
1.From Command Center Home, click Reporting > Meter Change Out Report to display the Meter Change Out Report window.

Figure 6 - 20. Meter Change Out Report Window
2.Select from the following options to base the report on:
•All. Select the All radio button to select all meters in the organization.
•Meters. Select the Meters radio button and then enter the desired meter number(s) separated by spaces, commas, or semicolons.
...or...
•Click the Find a Meter icon and browse to a meter location.
3.Date. Select a date format from the choices:
•Click the Quick Select radio button and choose a time frame from the drop-down.
...or...
•Click the Start Date radio button and select a start date and end date from the Calendar drop-downs
4.Actions. Select the two check boxes to include additions and removals of meters that aren’t technically a part of the “meter changeout” process. This could include any deployed or removed meters from the past.
5.Results. Select from the following three options to view the report:
•Display in browser. Select the Display in browser radio button to view the report in HTML format.
•Save to spreadsheet. Select the Save to spreadsheet radio button to save the report in a Microsoft Excel format.
•Save to CSV file. Select the Save to CSV file radio button to save the file in comma-separated-value format to a location on your computer.
NOTE: When exporting to a CSV file, it is not recommended to use meter numbers including the 'E' alpha character followed by numeric characters as Microsoft Excel will automatically convert them to scientific notation.
6.Click the OK button to generate the Meter Change Out Report.

Figure 6 - 21. Meter Change Out Report
The report is divided into two sections:
•The left side of the window displays the Removed Meters. The removed meters section displays:
•Meter Number
•Removal Date
•Endpoint ID
•Final Reading
•Removal Reason
•The right side of the window displays the Added Meters. The added meters section displays:
•Meter Number. Click the meter number link to view the Endpoint Properties report for the selected meter.
•Installation Date
•Endpoint ID
•Initial Reading
•Map Loc. Displays the Organization Secondary Identifier as selected for the organization on the Organization Information window. This could be the Customer Number, Account Number, Service Location Number, or Map Location Number.
•Service Location
•Door Seal
•Glass Seal
7.Click the Printer icon in the upper-right corner of the window to print a formatted copy of the report.
8.Click the Close button to close the window.
The Endpoint/Meter Selection window provides a list of Available Tasks the user can apply to the selected endpoint or meter. The list of tasks will vary depending on the status of the endpoint or meter.
•Provides the user with the ability to add or change editable endpoint and meter properties.
•Allows the user to view historical endpoint/meter associations.
•Allows endpoints and meters to be deleted or archived from the system.
•Allows the user to remove an endpoint from service and put it back into inventory.
1.Click Operations > Endpoints to display the Endpoint/Meter Selection window.
2.To edit existing meter or endpoint information, enter the desired endpoint or meter number in the corresponding field or click the Find a Meter icon to search for a meter and click the Go button.
3.The current status of the endpoint and the list of Available Tasks for the selected Endpoint/Meter Selection are displayed.
NOTE: The list of available tasks will vary depending on the endpoint or meter status.

Figure 6 - 22. Available Tasks Added to Window
The following tasks are available depending on the endpoint and meter status.
•Installation of Endpoint at an Electric Service
•Edit Endpoint Properties.
•View Endpoint Service History
•Archive Endpoint. Click the Archive Endpoint link to delete the selected endpoint. If a meter has any service history attached to it, the Archive Endpoint option will not appear.
•Remove Endpoint from Service
NOTE: Archiving an endpoint or meter precludes it from being included in Inventory status on the Dashboard or reports showing the inventory status. Endpoints can be removed from the archive status.
Installation of Meter at an Electric Service
Following is the procedure for installation of a meter at an electric service:
1.Click Operations > Endpoints.
The Endpoint/Meter Selection window will open.
2.Enter the new Meter Number. The new meter must already exist in Inventory status in Command Center. The Available Tasks list will appear. This list will vary based on model of the meter.

Figure 6 - 23. Endpoint/Meter Selection
3. Select Installation of Meter at an Electric Service. The Installation of New Meter Electric Service window will open.
Figure 6 - 24. Installation of New Electric Service
4.Enter Endpoint Information.
•Endpoint Serial Number. This field is not accessible.
•Installation Date. Provide date meter was installed.
•Add note. Optional, enter any installation notes.
5.Enter Installed Meter Information.
•Enter the Meter Number.
•Enter or edit the Meter Door Seal number. (Optional)
•Enter or edit the Meter Glass Seal number. (Optional)
6.Enter Customer Information.
•Enter Service Location.
•Enter or edit the Customer number.
•Enter or edit the Account number.
•Select a Billing Cycle from the drop-down list.
•Enter the Grid Location.
•Enter the Pole Number.
7.Enter Meter Location Information
•Enter meter Position
•Enter Map Location.
•Enter Latitude/Y Coordinate.
•Enter Longitude/X Coordinate.
•Select the correct Time Zone from the drop down list.
•Last Confirmed Time Zone. This field will only appear if the endpoint is installed in the field and has transmitted time zone information.
•Enter additional information in the Custom #1 field.
•Enter additional information in the Custom #2 field.
8.Enter Remote Service Switch State.
•Select Last Known Switch State from the drop down box. This indicates whether the meter is connected or disconnected.
9.Click Save to save changes.
NOTE: Meter Location entries are optional for RFS endpoints only. However, mapping functionality of Command Center will not function without latitude and longitude coordinates. Service Location must be entered if Latitude and Longitude are entered.
Remove Existing Meter from Command Center
This function allows the user to remove a deployed meter from service. The removed meter can either be put back into inventory or archived.
1.Click Operations > Endpoints.
The Endpoint/Meter Selection window will open.
2.Enter the Meter Number of the existing meter.
3.Click GO. The Available Tasks list will appear. This list will vary based on model of the meter. The figure below displays a typical Available Tasks list.

Figure 6 - 25. Endpoint Meter/Selection Available Tasks
4.From the Available Tasks, select the Remove Endpoint from Service link. The Remove Endpoint From Service window will open.
Figure 6 - 26. Remove Endpoint From Service
5.Enter Removed Electric Meter Information:
•Enter the Final kWh Reading (Optional)
•Enter the Final Reading Date (Optional)
6.Enter Removed Endpoint Information. Select a reason for the removal from the drop down list box.
•Awaiting Re-deployment. This option will transition the endpoint to Inventory status.
•Permanently Remove From Service. This option will archive the endpoint. An endpoint in archived status will not be included in any Command Center reports.
7.Click Save to save changes. A message indicating the success or failure of the removal will be displayed.
1.Click Operations > Endpoints.
The Endpoint/Meter Selection window will open.
2.To edit existing meter or endpoint information, enter the desired endpoint or meter number in the corresponding field or click the Find a Meter icon to search for a meter and click the Go button.
The current status of the endpoint and the list of Available Tasks for the selected Endpoint/Meter Selection are displayed.
NOTE: Available tasks will vary depending on assigned role.
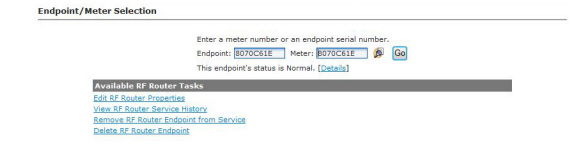
Figure 6 - 27. Available Tasks
3.Click the Details link to display the Endpoint Information Window.
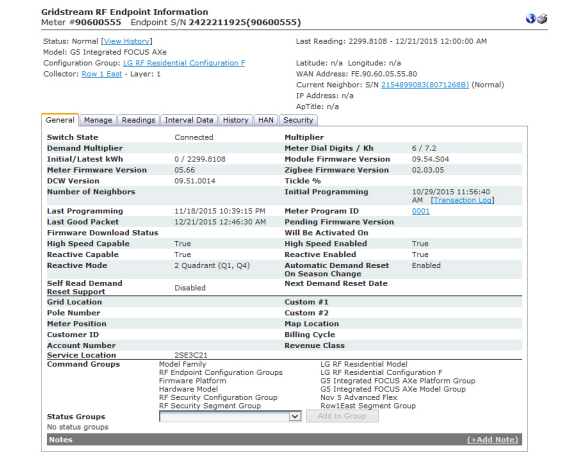
Figure 6 - 28. Endpoint Information Window
In the top section of the Endpoint Information Window the following information will be displayed:
•Meter #. Displays the number associated with the selected endpoint.
•Endpoint S/N. Displays the Landis+Gyr - assigned serial number of the endpoint in the selected meter.
•Status. Displays the current system status of the endpoint. Click the View History link to view the status changes for the selected meter.
•Last Reading. Displays the last kWh reading and the date and time it was received.
•Model. Displays the meter model.
•Configuration Group. Click the Configuration Group link to view the Configuration Group Properties menu.
•Collector. Displays the name of the collector on which the endpoint is deployed. Click the collector name to view the collector general settings tab.
•Layer. Shows the layer upon which the selected endpoint is operating
•Latitude/Longitude. Displays the latitude and longitude of the endpoint.
•WAN Address. Displays the WAN Address of the current neighboring endpoint.
•Current Neighbor. Shows the serial number and system status of the selected endpoint’s current neighboring endpoint.
•ApTitle. Displays the C12.22 application title (if applicable).
•Map. Click the Map icon to view the endpoint on a street map.
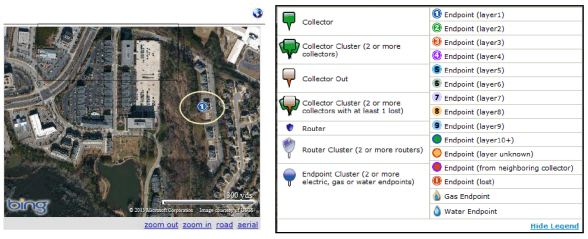
•The following actions can be performed on the Map:
•zoom out. Brings the viewpoint out further
•zoom in. Brings the viewpoint in closer
•road. Views roads on the map.
•aerial. Views the map in aerial mode. This is the default.
NOTE: Gas and Water meters will be depicted with a different icon as shown in the Legend above.
The General tab displays the following information:
•Switch State. For the FOCUS AX/SD the switch state indicates whether the meter is connected or disconnected.
•Multiplier. Displays the multiplier to be applied to kWh readings.
•Demand Multiplier. Displays the demand multiplier to be applied to kW readings.
•Meter Dial Digits/Kh. Displays the number of dials in the meter and the meter’s Kh.
•Initial/Latest kWh. Displays the original kWh of the endpoint and the latest reported kWh.
•Module Firmware Version. Displays the current firmware version of the endpoint/module.
•Meter Firmware Version. Displays the current firmware version of the meter.
•ZigBee Firmware Version. Displays the current Zigbee firmware version.
•DCW Version. Displays the current DCW version.
•Tickle %. A measure of what percentage of tickle packets sent to this neighbor were successful.
•Number of Neighbors. Indicates the number of neighbors for this endpoint.
•Initial Programming. Displays the original endpoint programming date.
•Last Programming. Displays the most recent programming date.
•Meter Program ID. Displays the Meter Program ID for all electric meters, including Cellular.
•Last Good Packet. Displays the date and time the last good packet was received.
•Pending Firmware Version. Indicates the firmware version currently queued for download to the endpoint.
•Firmware Download Status. Displays the status of the current Endpoint Firmware Download command.
•Will Be Activated On. Indicates the date the pending firmware version will be downloaded to the endpoint.
•High Speed Capable. A true or false value will be shown.
•Reactive Capable. Indicates the reactive capability of the endpoint.
•Reactive Enabled. A true or false value will be shown.
•Reactive Mode. Displays the meter quadrant area (if applicable).
•Next Demand Reset Date. Will display the next scheduled demand reset date.
•Grid Location. Displays the meter’s grid location (if applicable).
•Custom #1. User defined data field
•Pole Number. Displays the meter’s pole number.
•Custom #2. User defined data field.
•Meter Position. User defined data field.
•Map Location. Displays the endpoint’s map location (if applicable).
•Customer ID. Displays the customer’s identification number (if applicable).
•Billing Cycle. Displays the current billing cycle.
•Account Number. Displays the customer’s account number (if applicable).
•Revenue Class. Displays the revenue class. (if applicable).
•Service Location. Displays the customer’s service location (if applicable).
•Command Groups. Displays any Command Addressing Groups to which the module belongs.
•Status groups. Allows the user to add endpoints to a available status groups
To add the endpoint to a status group:
•Select a status group from the drop-down list box.
•Click the Add Group icon.
•Notes. Displays any notes entered into the system previously. Select the Add Note plus (+) sign to add a new note.
The Gridstream RF Endpoint Information - Manage tab allows the user to issue commands to the current endpoint and view commands previously sent to the endpoint.
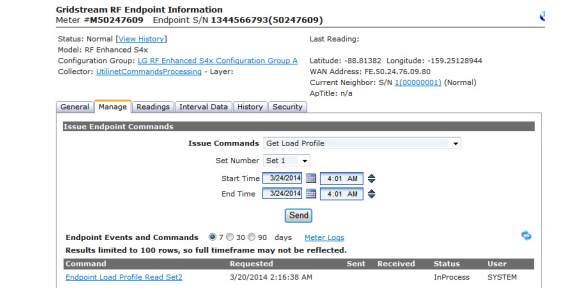
Figure 6 - 30. Manage Tab
Issue Endpoint Commands
NOTE: The commands displayed will be dependent upon the permissions granted to the user, the selected endpoint and the activated Command Center license(s).
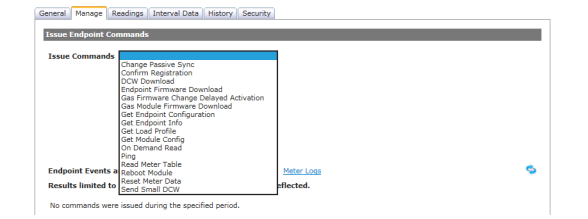
Figure 6 - 31. Issue Commands Selections Vary for Different Endpoint Types
NOTE: Commands displayed depend on licenses activated in Command Center and upon meter type.
|
Command |
Description |
|---|---|
|
Arm the Connect Switch |
This command enables the Arm button on the meter, allowing for the connection of service to be manually initiated at the meter. This option will only be visible if “Enable Arming” has been selected in the Organization Settings. |
|
Change Passive Sync |
The passive synchronization rate between an endpoint and a gas meter can be changed by issuing this command. A field representative may want to change the passive sync rate when troubleshooting a gas meter. For more information see Landis+Gyr Publication 98-1702: Implementing Two-Way Gas in RF Mesh. |
|
Confirm Registration |
This command will manually send a confirm registration request to the endpoint. |
|
Connect/Disconnect Status |
This command will provide the user with information on the current state of the switch as well as data on line side and load side voltage. |
|
DCW Download |
This command allows the user to select from a drop down box the desired dcw for download to the module. |
|
Demand Reset |
This command resets the peak registers in the meter and will return the demand reset data. |
|
Demand Reset/Cancel Scheduled Demand Reset |
This command allows the user to reset demand and cancel any future scheduled demand resets already sent to the meters to efficiently handle customers that are moving out/in of a residence or changing retail energy providers. When selected, the user will be able to choose whether to cancel demand reset and reset the demand, or simply cancel demand reset. |
|
Disable High Speed |
This command will allow the user to disable high speed configuration on the module. An endpoint must be on 5.5x module firmware or higher to support high speed functionality. |
|
Enable High Speed |
This command will allow the user to enable high speed configuration on the module. An endpoint must be on 5.5x module firmware or higher to support high speed functionality. |
|
Endpoint Firmware Download |
This command allows the user to select from a drop down box the desired module firmware. The user may choose to download the firmware immediately, or select a firmware activation date/time. |
|
Gas Module Firmware Download |
This command sends the gas communication module firmware to the electric meter or router parent and then sends the firmware to all associated gas meters. For more information see Landis+Gyr Publication 98-1702: Implementing Two-Way Gas in RF Mesh. |
|
Gas Firmware Change Delayed Activation |
This command allows the user to change the delayed activation date/time of firmware in the meter or activate the firmware immediately. For more information see Landis+Gyr Publication 98-1702: Implementing Two-Way Gas in RF Mesh. |
|
Get Endpoint Configuration |
This command will return the configuration report, meter data, measurement units, program data, demand measurement, service switch status, load profile configuration and metrics, factory data, service information and time offset. This command may be useful in verifying configuration of Failed endpoints. |
|
Get Endpoint Information |
This command will bring back useful network information that can help determine the state of an endpoint in the network. The information returns endpoint information, radio configuration, network connectivity health, endpoint date/time, collector and command center connectivity information. |
|
Get Event Log |
This command allows the user to select from a drop down list of event logs (HAN Events, Standard Meter Events, Manufacturer Meter Events, All Events) logged over a selected number of days. |
|
Get Firmware Update Log |
This command reads the firmware update log in the meter. Hash values are also provided. |
|
Get KYZ Settings |
This command allows the user to fetch KYZ configuration over the air for S4x meters. |
|
Get Load Profile |
This command allows the user to specify the date range for which Load Profile data is to be returned from the endpoint. The results of this command will be displayed on the Endpoint Information Interval tab. |
|
Get Module Config |
This command returns information that is not related to the meter, but key configuration of the module associated with the meter. It will return the confirmation that the AMR password is valid, the endpoint’s CRC, and time validation information. |
|
Get Service Limiting Program |
This command will return the current service limiting program of the endpoint. Refer to “Service Limiting” on page 199 for more information. |
|
Get Team Info |
|
|
Get Time |
The Get Time command response returns the meter date and time and the endpoint date and time. |
|
HAN: Clear Devices |
This command will clear all HAN devices with the meter. |
|
HAN: Commission Network |
This command will create the HAN network for the endpoint. |
|
HAN: Decommission Network |
This command may be issued to disable a HAN Network (for example in the case of a customer move out). |
|
HAN: Delete Device |
This command will delete a HAN device that is stuck in Provision Pending status. |
|
HAN: Firmware Download |
This command will allow the user to select ZigBee firmware from a drop down list to be downloaded to the ZigBee module. |
|
HAN: Get All Devices Info |
This command will return a list of ZigBee devices on the network for this endpoint. |
|
HAN: Get Device Info |
This command returns device information for a single device by MAC address and Short ID. |
|
HAN: Get Devices |
This command will return a list of ZigBee devices connected to this endpoint |
|
HAN: Get Firmware |
This command will return the firmware version of the HAN device associated with this endpoint. |
|
HAN: Get Network Info |
Returns HAN Channel ID and HAN Personal Area Network ID. This information is useful in determining whether a HAN network has been commissioned. |
|
HAN: Initialization |
This command initializes of the HAN device registers to properly display the TOU registers on the HAN device. |
|
HAN: Ping Device |
This command can be used as basic troubleshooting technique to ensure the ESP device is functioning. The response will be either “success” or “failed. In the event of a failure, the HAN device status will transition from Normal to Abnormal status. |
|
HAN: Register Device |
This command will join a HAN device to the meter. |
|
HAN: Send Message |
Allows the user to transmit a message to be displayed on the consumers HAN device. The message may consist of 25 characters. |
|
Meter Firmware Download |
This command allows the user to select from a drop down box the desired meter firmware. The user may choose to download the firmware immediately, or select a firmware activation date/time. |
|
Meter Program Download |
This command allows the user to send full or partial meter program changes to the meter |
|
Modify Meter Program |
This command allows the user to select from a list of meter programs to send over the air. |
|
On Demand Read |
This command will allow the user to select from a list of on-demand packets to be returned immediately by the module. |
|
Optical Lockout |
This command allows the user to enable/disable/view the status of optical probe access. The meter must be on 5.36 metrology or higher to send the command. |
|
Ping Endpoint |
This command returns a basic response from the endpoint. This command is useful in determining if communication is available to the endpoint via the mesh network. |
|
Read Demand Reset Data |
This command will return the data captured upon the last demand reset. |
|
Read Meter Table |
This command provides the ability to read ANSI C12.19 table from meter. The response is a list of table, offset, length, and data. When the data is returned from the meter it can be displayed in two formats, one is the RAW format as returned by the meter and the other is the interpreted format. A simple check box allows the user to choose which format is displayed. |
|
Reboot Module |
This command will cause the module to reboot, and can be beneficial if the modules is experiencing routing issues. The reboot will cause the endpoint to regenerate its neighbors list. A warning message will be displayed to confirm this action. |
|
Remote Connect |
This command instructs the meter to connect power at the consumer location. This command will not be visible if “Enable Arming” has been selected in the Organization Information settings. A warning message will be displayed to confirm this action. |
|
Remote Disconnect |
This command instructs the meter to disconnect power at the consumer location. A warning message will be displayed to confirm this action. |
|
Reset Meter Data |
This command will reset the meter registers to zero. This will issue a Master Demand reset command to the meter, allowing to reset the energy and demand values, and initialize load profile channels. This command will not delete the meter's programming. |
|
Send Small DCW |
Command allows user to send a small DCW to an endpoint. |
|
Set Service Limiting Program |
This command will allow the user to select from a list of service limiting programs and send the program to the endpoint. |
|
Time Sync |
This command request the module synchronize the meter’s time. This will cause the synchronization regardless of the extent of the time drift. |
|
Water Firmware Download |
This command sends the water communication module firmware to the electric meter or router parent and then sends the firmware to all associated water meters.For more information see Landis+Gyr Publication 98-1277: Implementing Two-Way Water Meters in RF Mesh. |
Use Infrastructure Routing
Use Infrastructure Routing is available for Routers, Mesh Extenders, Concentrators and any of the Grid Management devices. It is unchecked by default. The check box will only be enabled if the device has a valid WAN Address that is not a Mobile WAN address.

Figure 6 - 32. Use Infrastructure Routing
This feature gives the user the ability to specify that Command Center sends commands using Geo routing and using a persistent route even when the network is currently defined to be layered routing.
Endpoint Events and Commands
•Select the 7 or 30 or 90 days radio buttons for expanded data.
•Select the Meter Logs link to open the Log Viewer for the meter.
...or...
•View the events and commands in the manage window.
The Commands section displays the following information:
•Command. Displays the command that was issued.
•Requested. Displays the date requested.
•Sent. Displays the date sent.
•Received. Displays the date received.
•Status. Displays the status of the command.
•User. Displays the user that sent the command.
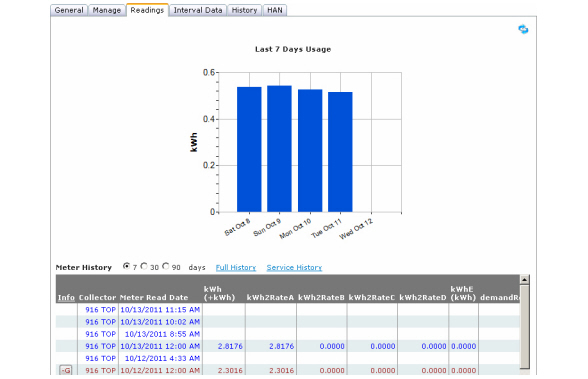
Figure 6 - 33. Readings Tab
The Readings tab displays the following information:
•Graphs depicting kWh usage for the selected day (above left) and the last 7 days (above right).
Meter History
The Meter History section displays the selected meter’s history for the previous 7 days and includes the following information:
•(Optional) Select the radio button for the previous 7 days (default), 30 days, or 90 days and then:
•Click the Full History link to view the Meter History window.
•Click the Service History link to view the Service History window.
•Info. Click the Info link to view the Meter History Reading Status information window for text color codes.
NOTE: The fields displayed in the table will vary based on the configuration of the endpoint.
The quality of a reading may be changed from non-billable to billable or vice versa:
1.Select the check box adjacent to the desired meter
2.From the drop down box select Make selected reading billable,
...or...
Make selected reading non-billable.
3.Click the Change button. The color coding of the reading will change and an Audit link will be displayed.
A record of the readings quality change may be viewed by clicking the Audit Link. A record of the change is also maintained in the Audit Log.
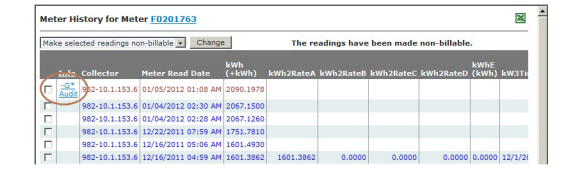
Figure 6 - 34. Meter History Viewer
The Interval Data tab, Figure 6 - 35, displays a graph and list of load profile data received from the endpoints for 1, 3 or 7 days. Select the Others radio button, to change the date range.
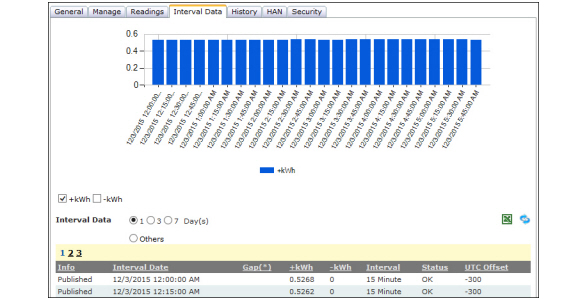
Figure 6 - 35. Interval Data tab
The Interval Data window provides the following information (columns may vary dependent on the configuration of the endpoint). Interval Data elements may be displayed separately on the graph, or together by selecting the data element check boxes.:
•Info. The Info column list displays the method in which the data was provided.
•Published Packet - indicates that the interval read was sent via the mesh by the module.
•Gap Analysis Packet - indicates that the data was retrieved through the Gap Reconciliation process.
•No Data Found - indicates that the data was not found for the requested time/date during the Gap Reconciliation process. This may be due to a power outage, daylight savings time, or simply that the time has not yet been reached for the desired interval.
•Interval date. The Interval data column lists the time and date the interval data was measured.
•Gap(*). An asterisk in this column indicates that there are gaps between readings. The missing intervals will be listed in the Interval Data Gaps section of the Interval tab.
•Load Profile Data. The values displayed are dependent on the configuration of the meter, and show the load profile data during the interval period.
•Demand Interval. The Demand Interval column lists the interval over which usage was measured.
•Interval Status: Indicates the quality of the interval data.
•OK - indicates a valid interval was received.
•Short - if a time change occurred during the interval period, the status column may indicate short. For example: time on the meter is set at 1:10am, meter time is changed to 1:15am. The reading would be marked as short, as 10 minutes are missing.
•Long - If a time change occurred during the interval period, the status column may indicate long. For example: time on the meter is set at 1:10am, meter time is changed to 1:00am. The 1:00am - 1:15am time would be marked as long, as it has an extra 10 minutes.
•Skipped. If a power outage or a time change occurred during the interval period.
•UTC Offset. The difference in minutes from Coordinated Universal Time (UTC) for the data time stamp.
•Interval Gaps
•The Interval Gaps section of the Interval tab will display a list of any gap readings that were not retrieved by Command Center
NOTE: Gap Reconciliation is an automated Command Center process to collect missing interval and self read data from Time of Use (TOU), interval, and demand meters. Network communication issues may occur causing a gap in either the interval data or the self read data. When enabled, the Gap Reconciliation process will try to retrieve the gaps.
NOTE: For meters that support two sets of Load Profile (for example: S4x, Elster A3, and REXU), the user can elect to display the 1st set of Interval Data or the 2nd set of Interval Data.
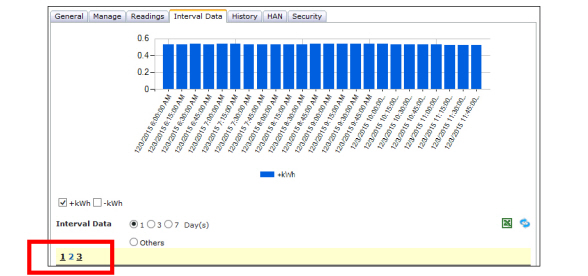
Figure 6 - 36. Interval Data Sets
There are three stages of Gap Reconciliation:
•Gap Detection. Gap Detection involves identifying missing self read data or interval data readings. Self read and interval data gaps are detected in the RF Readings process when interval data or self read data is received.
•Gap Collection. Gap Collection is the process used to collect the missing self read and/or interval data. The Gap Reconciliation process on the Setup > Process Settings page handles Gap Collection.
•Gap Retry. The Gap Retry process is responsible for preparing and storing the gap retry requests for those meters that have not responded to the initial gap request commands. A gap request command will be eligible for retry after a threshold amount of time before it gets picked up for retry. The Gap Retry process is enabled/disabled on the Setup > Process Settings page.
The History tab displays the history of endpoint events and errors. The information contained in the History tab is similar to that displayed in the Meter Logs report.
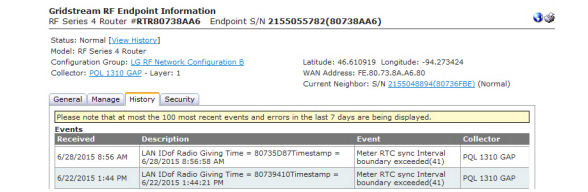
Figure 6 - 37. History Tab
NOTE: The events displayed will be dependent upon the permissions granted to the user, meter type, the selected endpoint and the activated Command Center license(s).
The Security tab provides a place for the security administrator to send endpoint commands related to security settings.
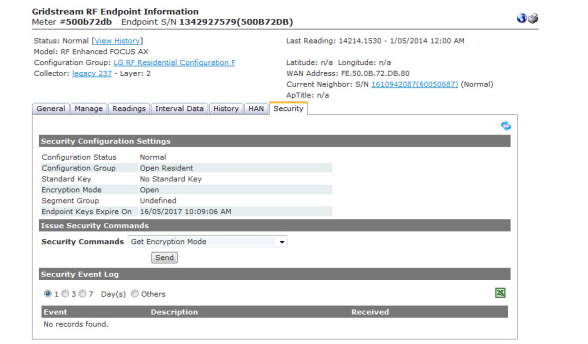
Figure 6 - 38. Security Tab
Security Configuration Settings
The Security Configuration settings are displayed:
•Configuration Status. The endpoint's security configuration status.
Valid values are Normal, Processing Keys, Distributing Keys, Failed and No Status. See Endpoint Security Status section for further information.
•Configuration Group. The endpoint's current Security Configuration Group.
•Standard Key. The endpoint's standard security key.
Valid values are: Endpoint, Current System Key, and No Standard Key.
•Encryption Mode. Valid values are: Open, Standard, Advanced.
•Segment Group. The endpoint's Segment Group. For Advanced Security Mode, a segment group will be assigned to each endpoint during Security Configuration. The Segment Group cannot be changed (see Segment Groups section for further information). For Open and Standard security modes, segment groups are not used.
•Endpoint Key Expires On. If the Organization Setting for Expiration is 0 and you are in Advanced Security, this value should display Never. For Open or Standard Mode it should display Not Applicable.
The following table displays the possible values for standard key, encryption, and encryption mode.
|
Standard Key Values |
Encryption Mode Values |
Description |
|---|---|---|
|
Endpoint |
Advanced |
Endpoints in Advanced security mode |
|
Current System Key |
Standard |
Endpoints in Standard security mode |
|
No Standard Key |
Open |
Endpoints in Open security mode |
To issue a security command, select one of the following commands from the drop-down list and click the Send button:
•Distribute Utility Public Key. Sends a command to the endpoint that updates the utility public key to the value contained in the command.
•Get Encryption Mode. When Get Encryption Mode command is executed, the endpoint's current encryption will be displayed.
•Get Security Configuration Information. When the Get Security Information command is executed, the endpoint's current security information will be returned.
•Security Reconfiguration. When the Security Reconfiguration command is issued to an endpoint, the endpoint will undergo the Security Configuration process. This command should be executed when an endpoint has a Failed security status. It can be executed for an endpoint in any endpoint status.
Once the command is issued, the next run of the 'RF Network Security Reconfiguration' process will pick up this request. Security Reconfiguration is a two command process. It will take two runs of the 'RF Network Security Reconfiguration' process to complete Security Reconfiguration for an endpoint.
•Security Reconfiguration With Default Key. When Security Reconfiguration Default command is issued to an endpoint, the endpoint will undergo the Security Configuration process. This command will retry Security Reconfiguration with a default key. The command should be issued when the following conditions are true:
•Endpoint has a Failed security status
•Security Reconfiguration command has already been executed
•Security Reconfiguration Previous command has already been executed"
To view the Security Event Log.
1.Select either the 1, 3 or 7 Day(s) radio button or select Others and select from a date range.
2.Click the Go button to view the events. Events may be also be viewed by selecting the Excel icon.
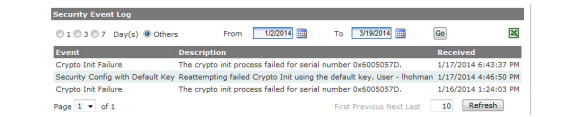
Figure 6 - 39. Security Event Log
The Manage Endpoints screen allows commands to be addressed to individual meters, multiple meter numbers, or a group of meters.
1.Click Network > Endpoints > Electric Group Commands.
The Manage Electric Endpoints window will open.
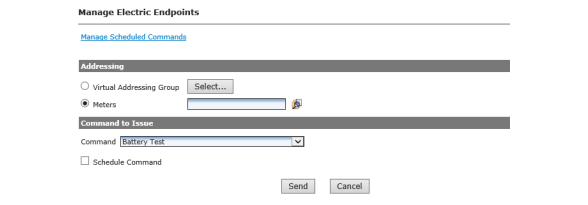
Figure 6 - 40. Manage Electric Endpoints
2.Select the desired type of Addressing:
•Virtual Addressing Group. Click the Select button and then select any, or all, command addressing groups to issue the command to from the drop-down list.
...or...
Meters. Enter the desired meter number(s) in the Electric Meter number field
or click the Find a Meter icon to search for a meter.
3.In the Command to Issue drop-down list select from among the commands listed.
4.If you want to schedule the command, select the Schedule Command check-box.
a.Enter a Name for the Scheduled Command.
b.Select the Schedule parameters:
•On specified dates. Specify one or more dates, separated by commas or by semicolons. If you want to change the specified start time, highlight the hour and type a different time or use the up and down arrows to change the time.
...or...
Select the Recurring radio button and click the calendar icon to select a start date. If you want to change the specified start time, highlight the hour and type a different time or use the up and down arrows to change the time.
•Click the Show Recurrence Options link to expand the window to display the recurrence options.
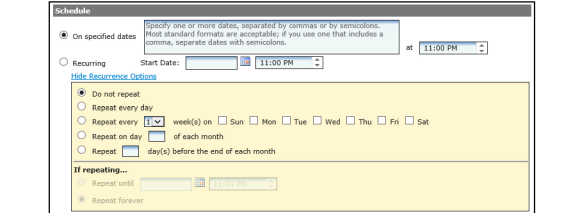
Figure 6 - 41. Schedule Commands
The Recurrence Options window expansion displays the following Scheduled Command options. Click the corresponding radio button to make your selection.
•Do not repeat. The Scheduled Command will occur once.
•Repeat every [1-2-3-4] week(s) on Sunday through Saturday. The Scheduled Command can be set to repeat every 1, 2, 3, or 4 weeks on any, or all, of the days of the week.
•Repeat on day [ ] of each month. The Scheduled Command can be set to repeat on the same date of each month. Enter a number from 1 to 31.
•Repeat [ ] day(s) before the end of each month. The Scheduled Command can be set to repeat every month on a specified number of days before the last day of the month.
If you elect to repeat the Scheduled Command, the following two options are also available.
•Repeat until [ ]. The Scheduled Command can be set to repeat until the user specified date by clicking the calendar icon and selecting the end date for the Scheduled Read.
•Repeat forever. The Scheduled Command can be set to repeat forever unless or until you change the end date.
5.Click the Send button.
You will receive the Your command was issued notification.
6.Click the Manage Scheduled Commands link to view, edit or delete existing scheduled commands. Schedules can be executed immediately or deleted from this page.
.jpg)
Figure 6 - 42. Manage Scheduled Commands
If applicable, Command Parameters of a scheduled command can be viewed by clicking the command name link.
.jpg)
Figure 6 - 43. Command Parameter
Broadcast commands may be issued to meters that are a member of a user defined addressing group or to any meter.
NOTE: Commands available are dependent on the permissions associated with the users’ assigned role.
Following is the procedure for issuing broadcast commands:
1.From Command Center Home, click Network > Endpoints > Broadcast Commands. The Broadcast Commands window will open.

Figure 6 - 44. Broadcast Commands
2.Select the Command to issue from the drop-down list box.
3.Select the Endpoint Model from the drop-down list.
On selection of an endpoint, the window will refresh.

Figure 6 - 45. Broadcast Commands
4.Broadcast Filter. The endpoints to receive the command can be specified by selecting one or more of the following filter options:
•ZigBee Capable. Select Yes or No.
•Module Firmware. Select from drop-down menu.
•DCW. Select from drop-down menu.
•Command Group. Click Select and choose a command group.
5.Select Collectors or Collector Groups. Click the radio button to choose a collector or collector group. Collector or Collector Groups can selected by entering names in the text box or using search criteria.
•Collector Search. Click Search and enter specific search criteria. Click OK.
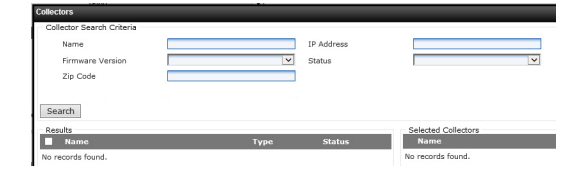
Figure 6 - 46. Collector Search Criteria
•Collector(s). Enter a collector name(s) in the text box.
•Collector Group Search. Click Search and enter specific search criteria. Click OK.
•Enter a Collector Group name and click Search. The results will be displayed.
•Select a specific Collector Group from the results.
•Click OK.
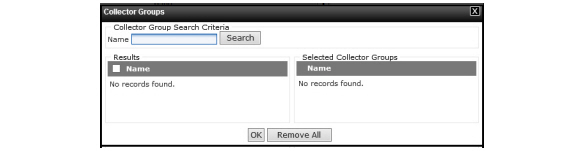
Figure 6 - 47. Collector Group Search Criteria
•Collector Group(s). Enter a collector group name(s) in the text box.
6.Command Overrides. Specify the following parameters to limit network traffic:
•Maximum Hops. Enter the maximum number of hops to allow.
•Maximum TTL. Enter the maximum Time To Live for the command in seconds.
•Maximum Segments. Enter the maximum segments to allow.
7.Click Send. A confirmation that the command was issued will be displayed.
The results of the command can be viewed on the Endpoint Information window Manage tab, and in the Log Viewer.
Broadcast Firmware Download Summary
Select the Endpoint Firmware Download command, status will be shown as In Progress. Select Pause and then resume to complete the download.
1.From Command Center Home, select Network > Endpoints > Broadcast Firmware Download Summary.
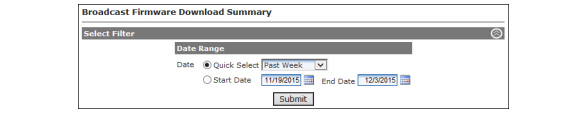
Figure 6 - 48. Broadcast Firmware Download Summary
2.Select the Quick Select radio button to select a date range.
...or...
Select a start and end date from the calendars.
3.Click Submit. The Firmware Download Summary report will open
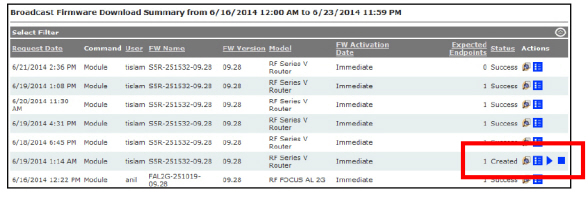
Figure 6 - 49. Broadcast Firmware Download Summary Report
4.Click ![]() to view details for the request.
to view details for the request.
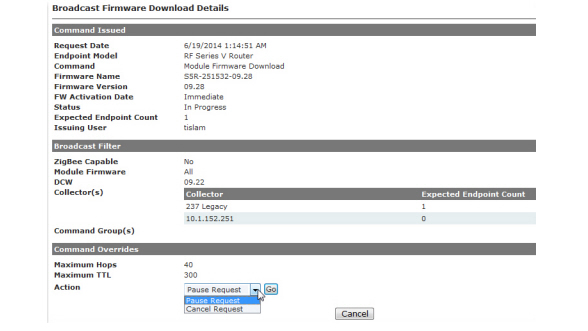
Figure 6 - 50. Broadcast Firmware Download Details
5.Select the Pause Request or Cancel Request command from the Action drop-down menu.
6.Select Go to issue the command.
The Scheduled Reads feature allows the user to schedule the time and date that a command is sent.
The Scheduled Read function is used for requesting On-Demand packets containing metering, outage, and diagnostics data.
1.Click Operations > Scheduled Reads > Select Endpoint Type.
•RF Residential
•RF Commercial
The Scheduled Reads window will open.
Figure 6 - 51. Scheduled Reads Window
2.To view past or future scheduled reads, click the Schedule criteria drop-down list to select Future or Past scheduled reads (optional).
3.Click the New button to display the Scheduled Read window.
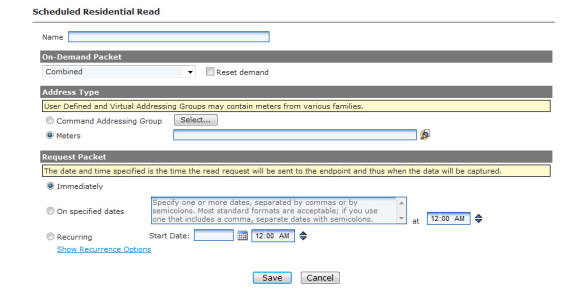
Figure 6 - 52. Scheduled Read Window
4.Select an On Demand Packet from the drop-down list.
NOTE: Only packets designated as On Demand Packets at the time they were created will be displayed in the list.
5.Select the Reset Demand check box if desired. If the reset demand check box is selected, on the specified date the endpoint will capture the maximum demand, reset the demand register, and then perform the requested reading. The request to do this may be sent to the endpoint up to one month in advance.
6.Select the Address Type.
a.Click the Command Addressing Group radio button. Click the Select button and choose the address type from the drop-down list. This drop-down list allows for multiple selections. Select as many or as few Command Addressing Groups as desired.
...or...
b.Select the Meters radio button and enter a single meter number or a group of meter numbers.
NOTE: On the specified date the endpoint will capture the maximum demand, reset the demand register, and then perform the requested reading.
7.Under Request Packet select one of the following:
a.Select the Immediately radio button to send the packet immediately.
...or...
b.On specified dates radio button and then specify one or more dates separated by commas or semicolons in the text box. Most standard date formats are acceptable. If you use a date format that includes a comma, separate the dates with a semicolon.
...or...
c.Select the Recurring radio button and click the calendar icon to select a start date. If you want to change the specified start time, highlight the hour and type a different hour or use the up and down arrows to change the hour. Highlight the minutes and type different minutes or use the up and down arrows to change the minutes. To select AM or PM, click the AM icon to toggle between AM and PM.
•Click the Show Recurrence Options link to expand the window to display the recurrence options.
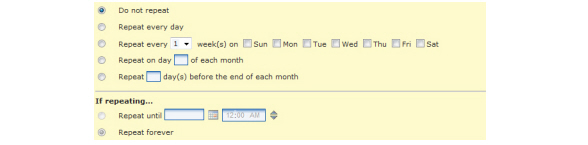
Figure 6 - 53. Recurrence Options
The Recurrence Options window expansion displays the following Scheduled Read options. Click the corresponding radio button to make your selection.
•Do not repeat. The Scheduled Read will occur once.
•Repeat every [1-2-3-4] week(s) on Sunday through Saturday. The Scheduled Read can be set to repeat every 1, 2, 3, or 4 weeks on any, or all, of the days of the week.
•Repeat on day [ ] of each month. The Scheduled Read can be set to repeat on the same date of each month. Enter a number from 1 to 31.
•Repeat [ ] day(s) before the end of each month. The Scheduled Read can be set to repeat every month on a specified number of days before the last day of the month.
If you elect to repeat the Scheduled Read, the following two options are also available.
•Repeat until [ ]. The Scheduled Read can be set to repeat until the user specified date by clicking the calendar icon and selecting the end date for the Scheduled Read. To change the end time, highlight the hour and type a different hour. Highlight the minutes and type different minutes. To select AM or PM, click the AM icon to toggle between AM and PM.
•Repeat forever. The Scheduled Read can be set to repeat forever unless or until you change the end date.
8.Click the Save button to initiate the Scheduled Read on the selected date.
Within the RF Mesh network, there are high speed endpoints and low speed endpoints. Both can exist in the same RF Mesh network as long as they remain on module firmware version 5.50 or higher. An endpoint is considered low speed if the baud rate is less than or equal to 38400 kbps (kilobit per second). Endpoints on 5.2x or lower module firmware operate low speed. An endpoint is considered high speed if the baud rate is greater than 38400 kbps.
NOTE: It is recommended that all endpoints have module firmware 5.5x or higher prior to enabling high speed on the endpoints. If the utility has a large number of endpoints, it is recommended that each region have 5.5x module firmware or higher.
Endpoints running firmware 5.2x or older do not have the ability to communicate directly with endpoints operating in wide channel mode. Endpoints running 5.2x firmware can only communicate with other endpoints in narrow channel mode.
Because of this restriction, most endpoints associated with a collector should be upgraded to 5.5x firmware prior to enabling any high speed endpoints. A small percentage of endpoints running 5.2x firmware should be ok amongst high speed radios, but they will be forced to communicate via other narrow channel radios, rather than communicating directly with the high speed radios.
Following is the procedure to change Enable High Speed:
1.In the RF Endpoint Information General Settings confirm that the endpoint is high speed capable.
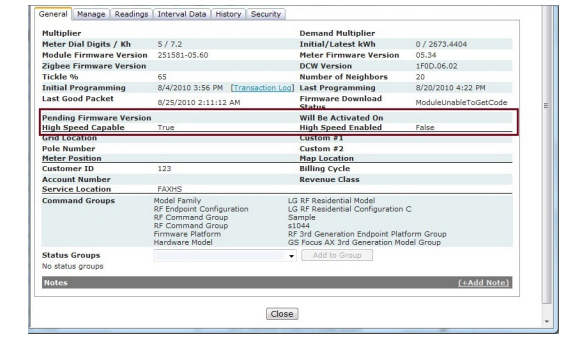
Figure 6 - 54. Gridstream RF Endpoint Information
2.Verify High Speed Capable. Confirm that High speed capable displays True to indicate if the endpoint can be set to high speed. Some endpoints do not support high speeds. If an endpoint is high speed capable, the user can issue an Enable High Speed command to change the endpoint to high speed.
3.Verify High Speed Enabled. If High Speed Enabled is True, high speed capability has already been enabled on the endpoint.
4.Click the Manage tab.
5.Select the Enable High Speed command from the Command drop down list. If the endpoint is on a module firmware version lower than 5.5x, the command will not be available.
6.Click the Send button to Enable High Speed.
When the Enable High Speed command is issued from Command Center, the command will be sent to the endpoint. The endpoint’s speed will be changed to high. The channels will be changed to 86 and the channel mode will be changed to wide. If all endpoints on the system are not 5.X or greater, a warning will be displayed.

Figure 6 - 55. Enable High Speed warning
The endpoint will reboot and re-acquire its neighbors. In re-acquiring its neighbors, it will advertise to these neighbors that it is at a high speed.
Command Center provides the ability to perform on demand and scheduled service connect/disconnect for a single meter or a group of meters.
Acknowledgment to a connect/disconnect is received by the requesting system within 1 minute of the request initiation. Command Center will retry transmitting disconnect/reconnect command to the endpoint if acknowledgment is not received within default 15 minutes (default). Command Center will attempt to send the disconnect/connect command to the endpoint five times, after which an alert will be generated on the dashboard.
Following is the procedure for issuing connect/disconnect commands:
1.From Command Center Home, select Operations > Remote Service Switch > Manage RSS Endpoints. The Manage RSS Endpoints window will open.
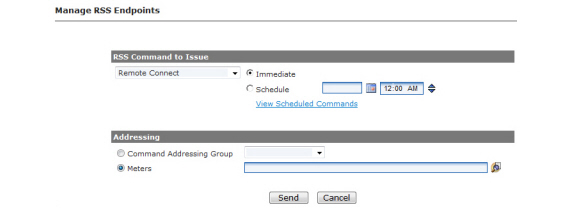
Figure 6 - 56. Manage RSS Endpoints
2.RSS Command to Issue.
a.Select the RSS Command to Issue from the drop down list.
•Remote Connect
•Remote Connect with ODR
•Remote Disconnect
•Remote Disconnect with ODR
b.Select the Immediate radio button to issue a command to connect/disconnect the service immediately
...or...
c.Select the Schedule radio button to schedule a command to connect/disconnect service at a point in the future. Enter the Date and Time the connect/disconnect is to occur.
3.Optional, click View Scheduled Commands to view scheduled connects/disconnects.
4.Addressing.
•Select the Command Addressing Group radio button and select a Command Addressing Group from the drop down list.
...or...
•Select the Meters radio button and enter the meter number(s) to which the connect/disconnect command will be issued.
5.Click Send.
NOTE: If a blackout window has been established for the Remote Disconnect or Remote Connect commands, the following warning message will be displayed when the command is issued.
The command has a blackout window of 1:00AM-2:00AM during which no commands should be submitted. Please select the Continue button to override the blackout window and submit the command to the meter.
The RSS Command History report allows user to review transaction details regarding immediate connect/disconnects.
Following is the procedure for generating the RSS Command History report:
1.From Command Center home, select Operations > Remote Service Switch > Command History. The RSS Command History window will open.

Figure 6 - 57. RSS Command History
2.Enter Selection Criteria.
•Select the All radio button to view results for all RSS meters
...or...
•Select the Meters radio button and enter the desired meter number.
3.Enter Date Range.
•Select the Quick Select radio button and choose an option from the drop down list box
...or...
•Enter a Start Date and an End Date. If needed select the calendar icon to generate a calendar from which to choose dates.
4.Unconfirmed Only. Select this check box to filter the report to just the meters that have not sent confirmation to a connect/disconnect command.
5.Click OK. The RSS Command History report will open.
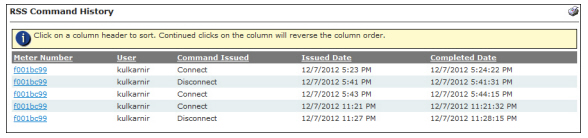
Figure 6 - 58. RSS Command History
The RSS Command History displays the following information:
•The meter number that the action was performed upon
•The user that performed the connect/disconnect
•The Command that was issued
•The date the command was issued
•The date the command(s) was initiated by the meter (event returned a confirmation that the action was performed successfully).
Report provides a list of which meters have Remote Service Switch (RSS) devices installed. In addition to displaying the current known status of each endpoint, the window allows the user to take action on any selected RSS meter.
Following is the procedure for generating the RSS Meters Report:
1.From Command Center home, select Operations > Remote Service Switch > RSS Meters Report. The RSS Meters Report window will open.
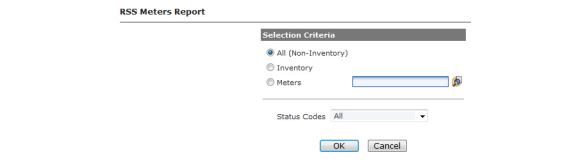
Figure 6 - 59. RSS Meters Report
2.Selection Criteria. Select one of the following criteria for filtering the report.
•All to view all RSS meters in the system
•Inventory to view all RSS meters that are in inventory
•Meters to view an individual meter
3.Status Code. Select the desired status code from the drop down list box.
4.Click OK. The RSS Meters Report will open.
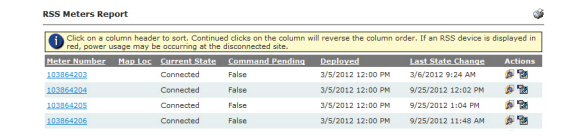
Figure 6 - 60. RSS Meters Report
The Service Limiting feature provides the utility with an interface for creating or modifying Service Limiting programs. The Service Limiting program allows the utility to set usage thresholds for customers, and allow temporary disconnection of the service when this threshold is breached.
Following is the procedure for creating a Service Limiting Program:
1.From Command Center Home, select Setup > Service Limiting Programs. The Manage Service Limiting Programs window will open displaying any currently created programs.
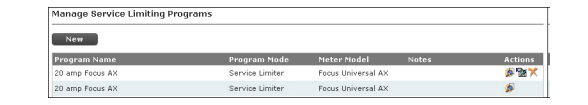
Figure 6 - 61. Manage Service Limiting Programs
2.Click the New button. The Service Limiting Program Properties window will open.
3.Meter Model. Select a Meter Model from the drop-down menu. When a model is selected, the screen will refresh providing additional configuration parameters:
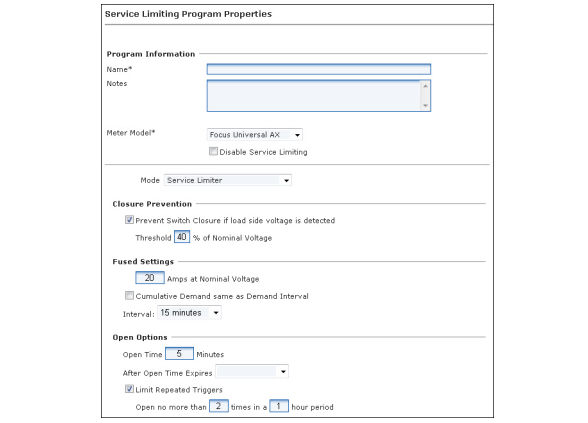
Figure 6 - 62. Service Limiting Properties
1.Enter Program Information.
•Name. Enter a name for the program. This name should identify the program or customer group targeted with this Service Limiting program and be unique to the organization.
•Notes (Optional). Enter any desired notes.
•Meter Model. Select a model from the drop-down menu.
2.Select the Mode.
•Service Limiter. If Service Limiter is selected, the switch will open when a configured load threshold is exceeded at the end of the sample interval. In Service Limiter operation, the trigger is an average value measured over a configured interval analogous to interval demand readings.
•Manual or Comm Only. If Manual or Comm Only is selected, the switch can only be operated via communications from an AMR device, or software application sending a command to Open, Close, or Arm the switch, or by using the Reconnect Switch to close an Armed switch.
3.Disable Service Limiting. Check this box to indicate the new program is specifically intended to disable Service Limiting and reset the meter table values back to defaults.
4.Closure prevention
•Prevent Switch Closure if load side voltage is detected. When selected, the meter will reject commands to close the service disconnect switch when load side voltage exceeds the configured percentage of nominal voltage.
For example, if the closure prevention is enabled and the configured threshold set to 5% of nominal voltage, the meter will reject a command to close if it detects in excess of 12 V of load side voltage.
•Threshold Percent of Nominal Voltage. Enter the desired threshold. Legal Values: 0 to 60% of Nominal Voltage when enabled. A value of 0 will disable the check.
5.Fused Settings
•Amps at Nominal Voltage. For Service Limiter operation, the trigger is a cumulative value analogous to interval demand where the interval can be set to be the same as the meter's demand interval, or a separate value in minutes. Once triggered, the switch will remain open for the configured Open Time and then perform the selected action when the Open Time expires.
•Cumulative Demand same as Demand Interval. Select check-box to enable the cumulative demand to be the same as the demand interval.
•Interval. Select the interval time from the drop-down list.
6.Open Options
•Open Time. If instantaneous power (measured in watts) reaches a (programmable) threshold value, the switch will open for a (programmable) period of time
•After Open Time Expires. Select the operation to be performed when the Open Time has expired. Select either Close Switch or Arm Switch from the drop-down list. When Armed, the switch will remain Open until the Reconnect Switch is pressed.
NOTE: The Arm Switch option will be available if the Organization Information > RSS Settings > Enable Arming setting is enabled.
•Limited Repeated Triggers.The Limited Repeated Triggers check box allows the user to enable/disable this option, which governs how many times the Service Limiting program will cut the power in the specified interval.
•When this box is checked to enable this option, the user must also enter values in the next row, to set the frequency and interval to limit open.close cycles for the meter.
•Current Command Center frequency threshold is limited to a range between 1 and 48 times.
•Current Command Center interval threshold is limited to a range between 1 and 24 hours.
•Current Command Center default for this threshold is 2 times in a 1 hour period.
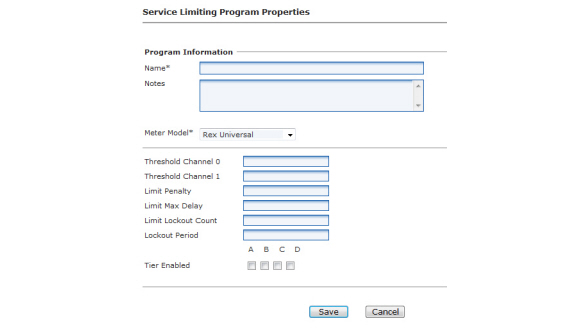
Figure 6 - 63. Service Limiting Rex Universal Program Properties
1.Enter Program Information.
•Name. Enter a name for the program. This name should identify the program or customer group targeted with this Service Limiting program and be unique to the organization.
•Notes (Optional). Enter any desired notes.
•Meter Model. Select Rex Universal from the drop-down menu.
2.Threshold Channel 0. Sets the demand threshold for demand channel 0. When current demand exceeds the demand threshold, the meter sets the demand threshold exceeded status flag. The meter also opens the disconnect switch if configured for demand limiting.
3.Threshold Channel 1. Sets the demand threshold for demand channel 1. When current demand exceeds the demand threshold, the meter sets the demand threshold exceeded status flag. The meter also opens the disconnect switch if configured for demand limiting.
4.Limit Penalty. Time in minutes (0 – 255 minutes). If configured for demand limiting, the meter will open the service control switch when the current demand exceeds the demand threshold. The switch will remain open for the remainder of the demand interval. At the end of the demand interval, the switch remains open for this demand limit penalty period.
5.Limit Max Delay. After the demand limit penalty, the meter will delay for a random amount of time before closing the switch. This parameter defines the maximum delay that will be generated. The delay is calculated with 5 second resolution providing a range of values from 0 (no randomization) to 21.25 minutes. For example, a value of 0x0A indicates the close time will be randomized between 0 and 50 seconds.
6.Limit Lockout Count. A value of zero disables this feature. If non-zero, specifies the number of demand limiting operations in a demand limit lockout period, which when met or exceeded, will permanently open the service disconnect switch. Lockout Period. Tier Enabled.
7.Lockout Period. Demand limit lockout period. The time period (1-255 hours) over which to monitor the limiting operations. There must either be an integer number of lockout periods per day or the lockout period must be an integer number of days. The default in Command Center is one.
8.Tier Enabled. This field allows demand limiting operation to be limited to specific tiers. If demand limiting operating is independent of tier, all of the flags are set to True (checked). To disable demand limiting, set all flags to False (0). Check the appropriate box(es) if demand limiting is enabled when the meter is operating in the selected Tiers (A, B, C, D). These boxes default in Command Center to False (unchecked).
a.Demand limiting is enabled when the meter is operating in Tier A.
b.Demand limiting is enabled when the meter is operating in Tier A.
c.Demand limiting is enabled when the meter is operating in Tier C.
d.Demand limiting is enabled when the meter is operating in Tier D.
Over the Air Meter Reprogramming
Command Center has the ability to make changes to meter program attributes, import meter programs to Command Center, and send meter programs via the RF Mesh network to an identified list of endpoints. This feature allows full and partial meter reprogramming using the Meter Program Download command.
•FOCUS AX meters
•FOCUS AXe meters
•S4x meters
•kV2c meters
The following prerequisites are required to perform over the air meter reprogramming:
•The latest version of 1132 tools (version 5.05 or higher) associated with Command Center 6.5 or higher must be installed.
NOTE: 1132ProgE650 must be used (not 1132Prog) to export meter programs.
•Command Center 6.5 firmware version and DCW firmware versions (or higher) must be installed on the meters.
Organization Information Settings
Additional Organization Information Settings have been added to establish global parameters for this command to enable Over the Air meter reprogramming.
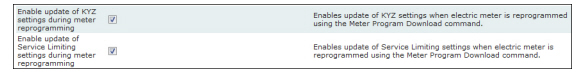
Figure 6 - 64. Organization Information Settings
Enable update of KYZ settings during meter reprogramming. If this setting is checked, the KYZ settings will be updated when electric meter is reprogrammed using the Meter Program Download command. This is defaulted to enabled. When the setting is disabled, Command Center will remove the KYZ tables from the meter program download script that is sent to the meter.
Enable update of Service Limiting settings during meter reprogramming. If this setting is checked, the Service Limiting settings will be updated when an electric meter is reprogrammed using the Meter Program Download command. This is defaulted to enabled.
Meter Program Download Command Settings. These settings are used to prevent commands from being executed during certain hours. See Table 3 - 14, "Command Specific Settings", on page 38.
•Blackout Window Begin Time. This is the begin time of the blackout window during which no Meter Program Download commands should be submitted.
•Blackout Window End Time. This is the end time of blackout window after which Meter Program Download command should be submitted.
•Enable the user to issue commands during the blackout windows. When this box is checked, the user is allowed to manually issue commands during the blackout windows. If the setting is not checked, the user can not issue commands during the blackout window.
If a blackout window has been established for the Meter Program Download command, and the Enable the user to issue commands during blackout window setting is enabled, the following warning message will be displayed when a command is issued during this blackout window. The command has a blackout window of [time - time] during which no commands should be submitted. Please select Continue button to override the blackout window and submit the command to the meter.
NOTE: Changes to these settings are recorded in Daily Activity Audit Reports.
Import the Meter Program Files
The Meter Program Download Command sends a new meter program to the meter. Following is the procedure to import a Meter Program that has been exported from a meter tool (i.e. 1132):
1.Select Setup > Meter Programs > Import Meter Program Download File. The Meter Program Import Summary is displayed.
Figure 6 - 65. Meter Program Import Summary
2.Click the Import button. The Import Meter Program screen will be displayed, as shown in Figure 6 - 66.
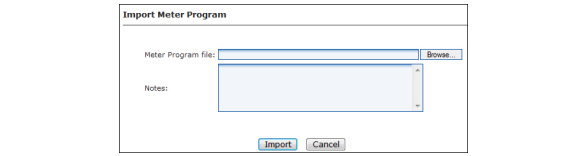
Figure 6 - 66. Import Meter Program
3.Meter Program File. Enter the complete path to the location of the Meter Program File.
...or...
Click the Browse… button and to navigate to the file location.
4.Notes (Optional). Enter any desired notes.
NOTE: Meter program names must be unique. If a duplicate meter file import is attempted, the following error message will be displayed: Meter Program Name is not unique
5.Click Import. The meter program will be imported and a Meter Program Imported event will be generated.
The meter program attributes will now display on the Meter Program Import Summary page.See Figure 6 - 65.
The Meter Program Import Summary displays the following fields:
•Show Archived Program. Check the box to display any Archived meter programs.
•Meter Program ID. Meter Program ID entered by the customer in 1132Prog tool.
•Model. End Device Model associated with the meter program.
•Import Notes. Notes entered by the user in Command Center when importing the XML file.
•Meter Program Name. Meter Program name entered by the customer in 1132Prog tool.
•Program Notes. Meter Program notes entered by the customer in 1132Prog tool.
•Import Date. Displays the date the file was imported.
•Imported By. Displays who imported the file.
•Actions:
•Click  to Edit the Program Notes.
•Click  to Archive or Reinstate the program. Meter programs may be archived even if they are associated with meters.
Meter Program Archived and Meter Program Reinstated events will be generated with the action. Audit entries will be displayed on the Meter Program Management Audit Report.
NOTE: The Meter Program ID, End Device Model and Misc ID must be unique to the organization.
The Misc ID is not available on the Command Center user interface. This ID is generated by the 1132Prog tool and is used behind the scenes. For ANSI meters, it is stored in the ANSI C 12.19 Standard Table 6 field.
6.Import Validation Rules:
•Duplicate programs cannot be imported.
•If an error occurs, a notification will be displayed.
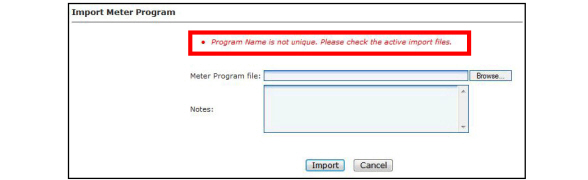
Figure 6 - 67. Program Name Error Message
NOTE: 1132 versions 5.05 or higher are supported. If the meter program is created in a version that is not supported by Command Center, an error will be displayed, shown in Figure 6 - 68.
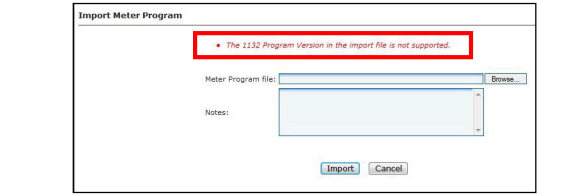
Figure 6 - 68. Minimum Version Error Message
Meter Programs can be archived. Archived Meter Programs will not display in the meter program drop-down list on the Meter Program Download command.
Following is the procedure to archive a meter program:
1.On the Meter Program Import Summary screen, select the Archive/Restore Program icon. A dialog box will be displayed requesting confirmation that the Meter Program should be archived, shown in Figure 6 - 69.
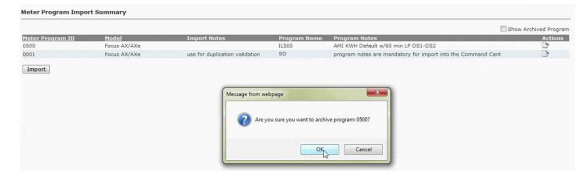
Figure 6 - 69. Archive Meter Program
2.Click OK to archive the program.
The archived Meter Program is no longer displayed in the meter program list, and will not be available as a choice for Meter Program download.
NOTE: Meter programs may be archived even when endpoints are associated with the program.
When meter programs are archived, they will be logged in the Command Center Audit Reports > Meter Program Management Reports. See “Audit Reports” on page 60.
In addition, the Meter Program Archived alert will appear under Log Viewer > Events and Setup > Events > Group Events.
Once a Meter Program has been archived, the user has the ability to reinstate the program.
Following is the procedure to reinstate a Meter Program:
1.On the Meter Program Import Summary screen, select the Show Archived Programs check-box. The Meter Program Summary Report will refresh displaying the programs that have been previously archived.
2.Select the Archive Restore Program icon. A dialog box will be displayed requesting confirmation that the Meter Program should be restored, shown in Figure 6 - 70.
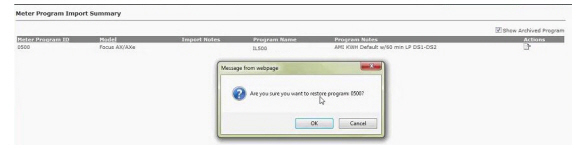
Figure 6 - 70. Un-archive Meter Program
3.Click OK to restore the Meter Program.
When meter programs are reinstated, they will be logged in the Command Center Audit Reports. See “Audit Reports” on page 60.
The Meter Program may be downloaded individually to the meter via the Gridstream RF Endpoint Information screen, or it may be issued group based from the Manage Electric Endpoints screen.
When the utility initiates a full program, master reset or load profile reset, they are authorizing these functions. If partial meter reprogram, Command Center compares old/new meter program attributes and determines whether the meter program change can proceed. These options are role driven, shown in Figure 6 - 71.
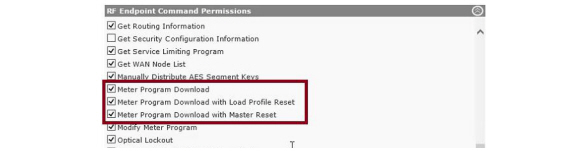
Figure 6 - 71. RF Endpoint Command Permissions
NOTE: Error messages will appear if the Meter Program change requires a full program, master reset or load profile reset, and the user did not authorize it or has not been given user role access.
Issue a Point-to-Point Meter Program Download Command
Following is the procedure to issue a Point-to-Point Meter Program Download Command:
CAUTION: Changing a meter program may cause loss of reading data in the meter.
1.From the Gridstream RF Endpoint Information Screen, select the Manage tab.
2.Select Meter Program Download in the Issue Commands drop-down box, shown in Figure 6 - 72.
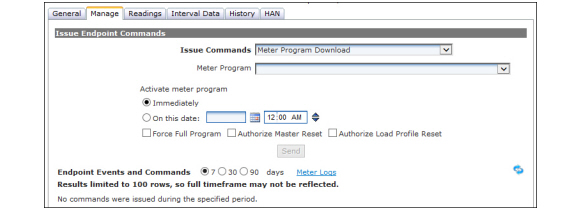
Figure 6 - 72. Meter Program Download Command
3.Meter Program. A list of meter programs will be presented for selection. Meter programs matching the end device model will be displayed. For example, if an S4x meter is selected, FOCUS AX meter programs will not be displayed. The meter program name will display in the following format (meter program id - meter program name - meter program notes). Archived meter programs will not display in the list. Select the desired Meter Program from the drop-down list.
4.Activate Meter Program. Select from the following options:
a.Immediately.Select the Immediately radio button if the meter program change should be activated after the download has completed.
...or...
b.On this date. The Meter Program packets will be sent to the meter immediately. The module will store the packets, and activate the program on the selected date.
5.Select the Meter Program type.
•Force Full Program. If the user has been granted access to the Meter Program Download with Master Reset, the Full Program check box will display. Select the check box to Force a full reprogram of the meter. Full Program will perform a master reset of the meter.
•Authorize Master Reset. If the user has been granted access to the Meter Program Download with Master Reset, the Master Reset check box will display. Select the check box to authorize a Master Reset on the meter if the meter program change requires it.
•Authorize Load Profile Reset. If the user has been granted access to the Meter Program Download with Load Profile Reset, the Load Profile Reset check box will display. Select the check box to authorize a load profile reset on the meter if the meter program change requires it.
6.Click Send to begin the Meter Program download.
Group Based Meter Program Download
Following is the procedure to issue a group based Meter Program Download:
1.Select Network > Endpoints > Electric Group Commands. The Manage Electric Endpoints screen will be displayed, shown in Figure 6 - 73.
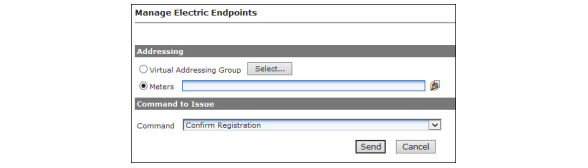
Figure 6 - 73. Manage Electric Endpoints
2.Addressing. Enter one of the following options:
a.Virtual Addressing Group. Click the Select.. button and choose the desired Virtual Addressing Group(s).
...or...
b.Meters. Enter desired meter numbers separated by commas, spaces or semi-colons.
3.Command. Select the Meter Program Download command from the drop-down list. Additional settings will be displayed.
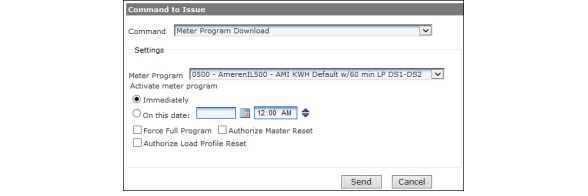
Figure 6 - 74. Additional Settings
4.Choose Settings.
a.Select the Meter Program from the drop-down menu.
b.Activate Meter Program. Select when to activate the meter program.
•Immediately. The new Meter Program will be activated on receipt of all the packets.
...or...
•On this date. The Meter Program packets will be sent to the meter immediately. The module will store the packets, and activate the program on the selected date.
c.Select the Meter Program type.
•Force Full Program. If the user has been granted access to the Meter Program Download with Master Reset, the Full Program check box will display. Select the check box to force a full reprogram of the meter. Full Program will perform a master reset of the meter.
•Authorize Master Reset. If the user has been granted access to the Meter Program Download with Master Reset, the Master Reset check box will display. Select the check box to authorize a Master Reset on the meter if the meter program change requires it.
•Authorize Load Profile Reset. If the user has been granted access to the Meter Program Download with Load Profile Reset, the Load Profile Reset check box will display. Select the check box to authorize a load profile reset on the meter if the meter program change requires it.
5.Click Send to begin the Meter Program download.
As the Meter Program download is performed, various events will be logged. These events are visible on the Gridstream RF Endpoint Information screen History Tab, the Log Viewer Events, and the Advanced Events search.
|
Event |
Event Description |
|---|---|
|
Download Image Command Received |
Event generated during the NMP download process. |
|
Invalid Meter Program Attempt |
The communication module firmware will trigger this event when the pre-programming CRC check fails. If the CRC check fails, the meter programming will abort. |
|
Meter Communication Error |
Event indicating the communications module cannot communicate with the metrology. |
|
Meter Program Archived |
The user has chosen to archive a meter program. |
|
Meter Program Awaiting Activation |
Event confirming the meter program is awaiting activation. |
|
Meter Program Change Complete |
The Meter Program download completed. |
|
Meter Program Change Failed |
Event indicating the meter program change has failed. |
|
Meter Program Change Started |
The Meter Program is actively being transferred to the meter. |
|
Meter Program Changed |
Event indicating that Meter Program ID has changed. |
|
Meter Program Imported |
Meter program has been imported into Command Center. |
|
Meter Program Reinstated |
The user has chosen to reinstate an archived meter program. |
|
New Meter Configuration Detected |
Event generated when a new meter configuration has been detected. |
|
Small DCW Installed |
Event indicating that a small DCW (small program) has been downloaded and activated. |
|
Transferring Image to Device |
Event generated during the NMP download process. |
Over the Air Meter Reprogramming Reports
The following reports contain information about Over the Air Meter Reprogramming.
The Meter Program Management Audit Report allows the user to select to view meter programs that were archived, or meter programs that were imported, archived or re-instated. See “Audit Reports” on page 60.
On the Reporting > Endpoint Data Export page, the Meter Program ID is available on the electric meter export. See “Endpoint Data Export” on page 285.
Download Command Summary Report
When a Meter Program Download command is submitted by the user on either the Endpoint Information > Manage page or the Network > Endpoints > Electric Group Commands page, the download statistics can be viewed on the Download Command Summary report.
This report is different than the Command History Report. The Download Command Summary Report uses events generated during the process to report progress. The Command History Report uses command log history information and cannot report statistics on download commands.
1.Select Network > Endpoints > Download Command Summary Report.
2.Enter a Start Date and End Date, click View.
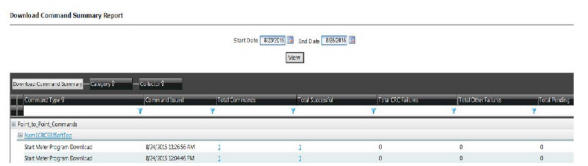
Figure 6 - 75. Download Command Summary Report
3.An entry will display on the report each time the Meter Program Download command is issued. The following table explains each of the columns for the report:
|
Column Name |
Description |
|---|---|
|
Command Type |
The command will display Start Meter Program Download command. |
|
Command Issued |
The command issued date/time. |
|
Total Commands |
The total number of meters that were issued the command. The number is a link to the list of meters. |
|
Total Successful |
The total number of meters that successfully sent in an event indicating the meter program change has completed successfully. The number is a link to the list of meters. |
|
Total CRC Failures |
The total number of meters that have reported a CRC failure. The number is a link to the list of meters. |
|
Total Other Failures |
The total number of meters that have reported a failure that is not a CRC failure. The number is a link to the list of meters. |
|
Total Pending |
The total number of meters that are still in progress. The number is a link to the list of meters. |